Wine not take another sip?
An exploration into the world of oenology
I love wine. I like to drink wine, I like to enjoy wine with good food and good company, and I like to pretend I know things about wine.
In reality though, I am no wine connoisseur and I often do not really know what the back of the wine bottle is telling me or what the sommelier is saying at the restaurant. And to be honest, I’ve always wondered if the descriptions given by these experts truly distinctly describe the specific wine, or if they simply offer a general or basic idea of the wine and then you just have to taste it for yourself to know (not that I’ve ever complained about tasting a wine). You have to wonder, how do all sommeliers taste the same thing and how can they accurately distinguish tens of thousands of different wines with only a couple sentences of description?
So, I did some wine research
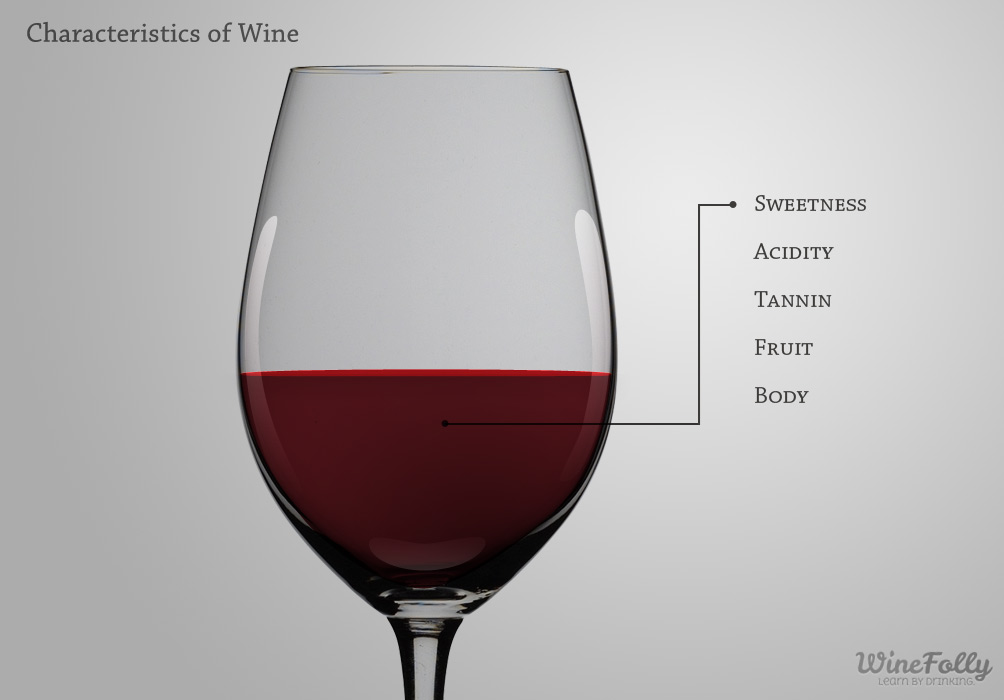
First, the word in the first header, ‘oenology’, means ‘the study of wines’ and is pronounced ‘ee-nol-uh-jee’. Second, I discovered that all wines are typically described by [five basic characteristics] (http://winefolly.com/review/wine-characteristics/): sweetness, acidity, tannin, fruit, and body. That helps to know that there is some sort of formula that somms follow when describing a wine, but are there really enough unique combinations of those five traits for each wine out there and if there are, do descriptions of similar wines demonstrate a trend in the characteristics?
And I set some goals
In order to answer these questions, I decided to break down the issues into slightly smaller chunks:
- Acquire a lot of data including different wines and their descriptions
- Transform the text data from the document space into vector space using natural language processing techniques
- Use unsupervised learning, specifically topic modeling, to project the vector into the topic space
- See if two clusters create interpretable topics, ideally corresponding to the division of red vs. white wines
- See if nine clusters create interpretable topics, ideally corresponding to the [nine primary wine styles] (http://winefolly.com/tutorial/the-9-major-wine-styles/), including full-bodied reds, medium-bodied reds, light-bodied reds, rosé wines, full-bodied whites, light-bodied whites, aromatic whites, dessert and fortified wines, and sparkling wines
- If the descriptions can successfully distinguish trends in wine types, build a recommendation system for user-generated descriptions
The Data, the Preprocess, and the Model
The wine descriptions came from Wine Enthusiast Magazine and were scraped from the week of June 15th, 2017 and compiled into a dataset on [Kaggle] (https://www.kaggle.com/zynicide/wine-reviews). There were over 150K rows of data, which were narrowed down to just over 97K after removing duplicates. There were over 600 grape varietals and over 50 countries represented in the dataset. The wines also came with tags for Region 1 and Region 2, price, points, winery, province, and designation. I stored all of the data in a collection on MongoDB, but only pulled the descriptions and the grape varietals to start. I preprocessed the descriptions by removing capital letters, punctuation, numbers, and stop and common words, such as ‘wine’, ‘flavor’, and ‘taste’, that had little semantic value in the given context. Then I used a TF-IDF vectorizer (with unigrams, a minimum document frequency of one, and ASCII-mapping for stripping accents) to one-hot encode all of the descriptions, or ‘documents’, into a document-term matrix. For the next steps, I used scikit-learn’s TruncatedSVD module to perform latent semantic analysis on the document-term matrix and reduce it into a topic space with varying numbers of topics.
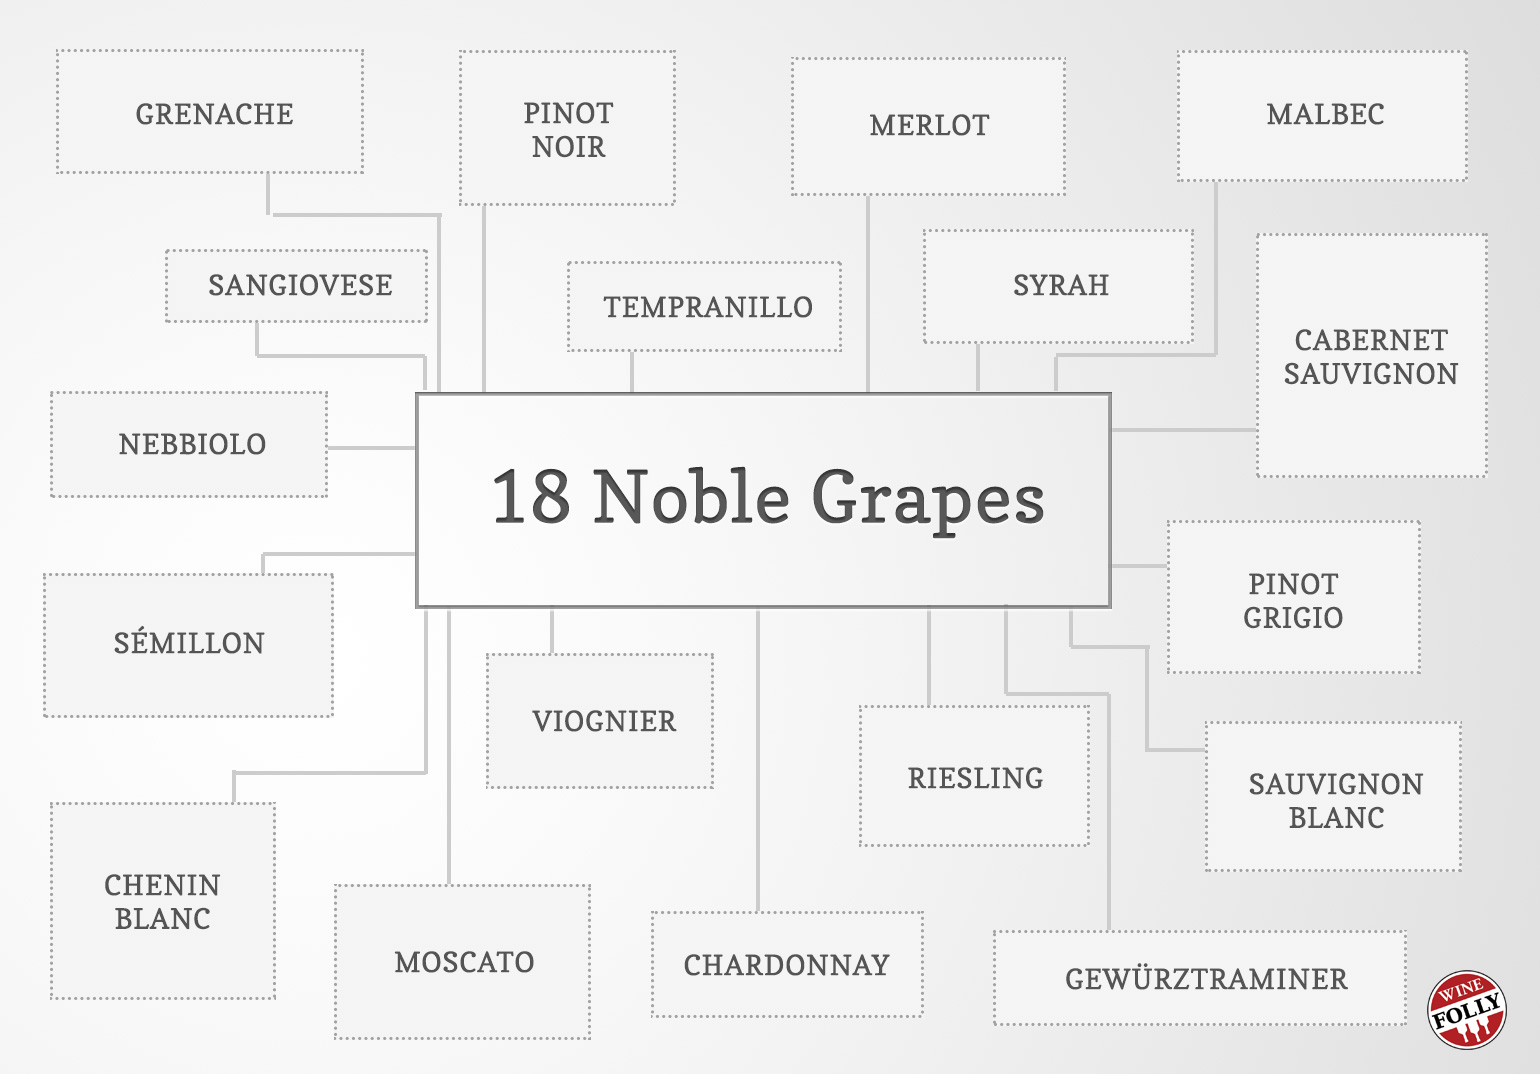
Simplifying Varieties: The Noble 18 Grapes
Because there were over 600 grape varietals, I tried aggregating them by variations of the same names, but I still had 300+ different kinds of grapes to look at. In order to simplify the interpretation of my topic modeling, I decided to focus on how each model clustered the Noble 18 Grapes. The [Noble 18 grapes] (http://winefolly.com/update/the-18-noble-grapes-wine-challenge/) include 18 major grapes that are readily available and represent a distinct flavor of wine. They cover a large spectrum of wines, which encompasses the major flavor profiles of most red and white wines in the world. They were also easily labeled in the list of over 97K wines, which made them ideal for checking the model clusters.
Two Topics: Red vs. White Wines
The Truncated SVD with two topics did a pretty great job separating red from white wine like I’d hoped. The plot below is colored according to the 18 Noble Wines, which I labeled by red and white.
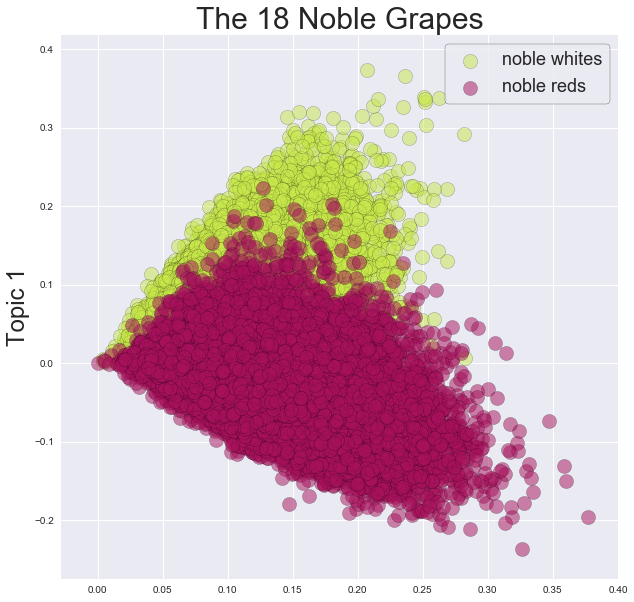
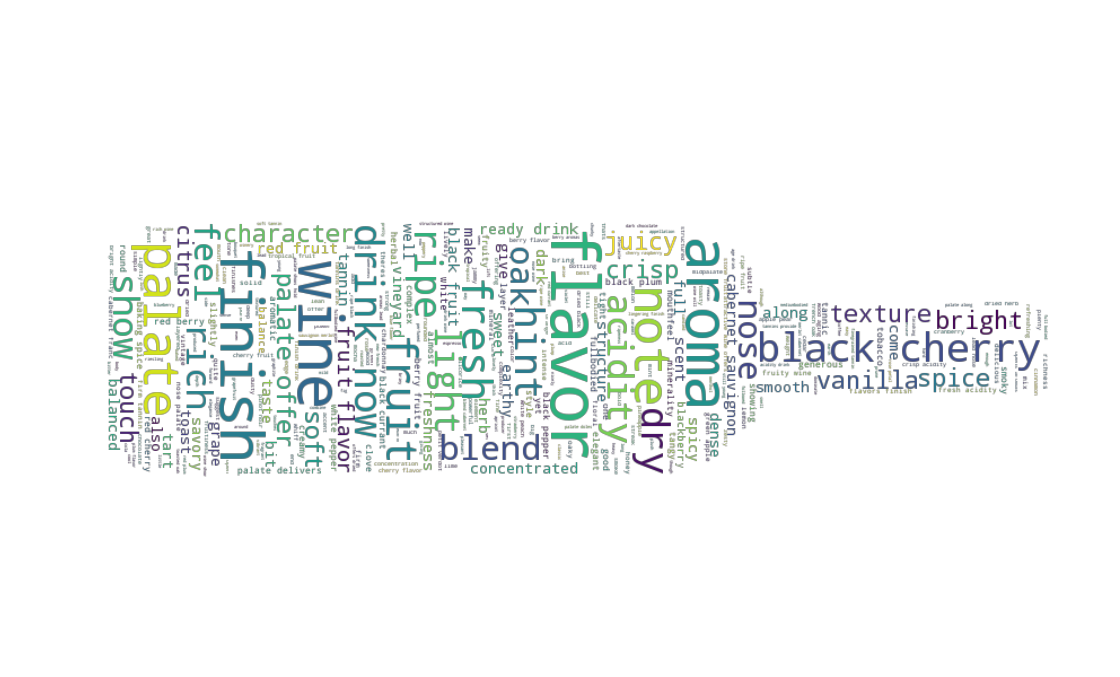
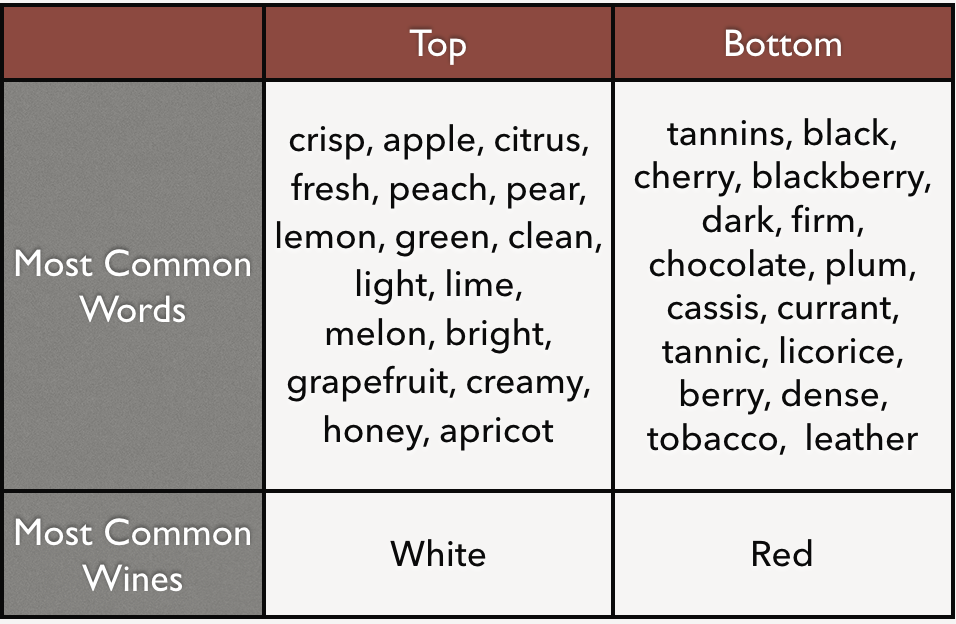
The topic displayed on the y-axis shows the clearest distinction between red and white wines. And, when I looked at the most common words in the descriptions at the extremes of the of the y-axis, the words from the top sounded notably like white wine-descriptors, while the words from the bottom sounded more like red wines.
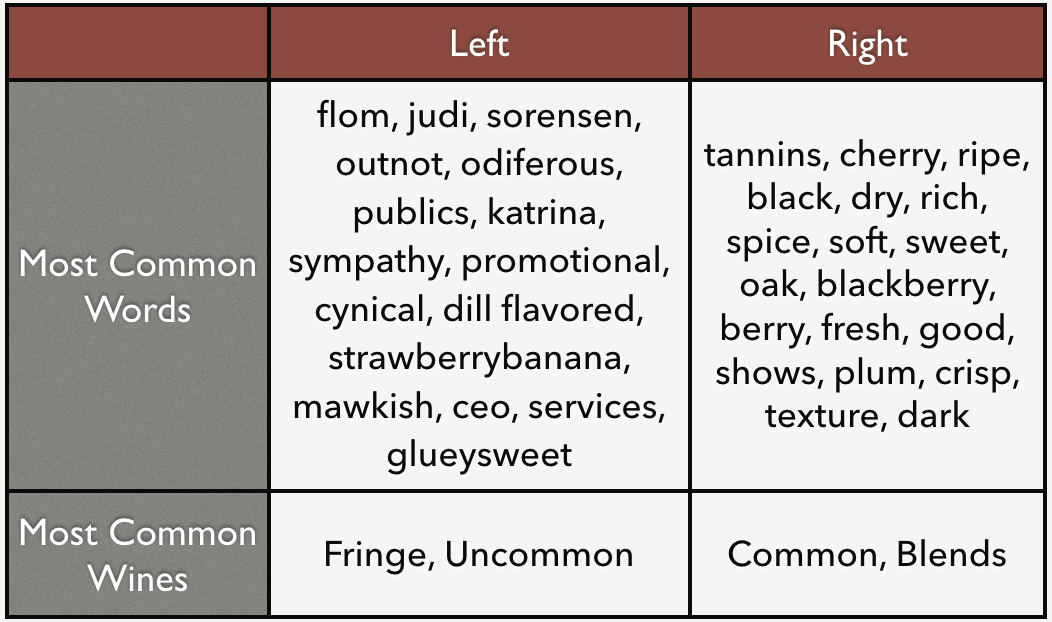
The topic on the x-axis, however, was not so clear. There is some pattern from left to right, but it affects both the red and the white wines. When I inspected descriptions from the extremes, I could see a large difference in the most common words. Some of the words on the left side were not even real words and most of them were not obviously related to wine. I determined that the second topic was distinguishing unconventional and uncommon wine descriptions from more traditional and basic ones. It was most likely picking up on the descriptions that included more information about the vineyard or the circumstances surrounding the production of that specific wine rather than information on the taste.
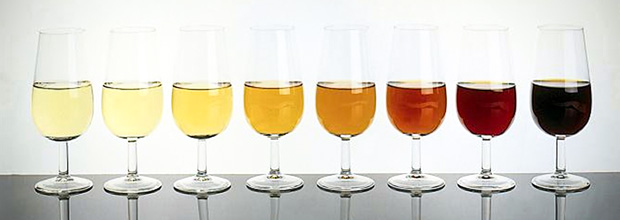
The two topics got even more interesting once I colored the data points by the specifc wines of the Noble 18. The animation below shows the wines colored in gradients of green and purple, for white and red wines respectively, where the gradients correspond to the weights of the wines, ie. Pinot Grigio is the lightest-bodied wine of the whites and is colored the lightest. As the animation cycles through the description clusters, it reveals a pattern: the wines rotate clockwise about the origin from lightest white at the top to darkest red at the bottom. I did not expect to see this result because almost none of the descriptions explicitly label the wines’ weights. This colorized plot demonstrates that the weight could potentially be extrapolated from the rest of the description. This finding encouraged me to explore topic modeling with a greater number of topics (hopefully that correspond to more specific styles of wines).
Nine Topics: The Spectrum of White to Red Wines
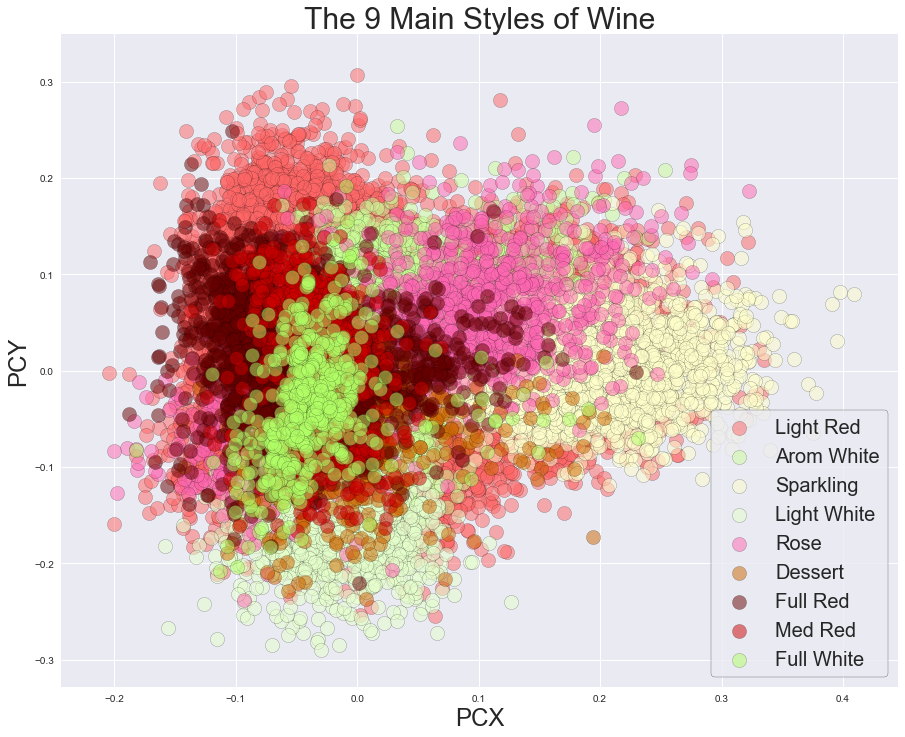
In the next phase of exploration, I ran the TruncatedSVD with 9 topics to see if the descriptions could distinguish the nine major styles of wine, as listed in the above gif. The resulting nine topics and their most common terms appeared to distinguish the 9 styles of wine. In order to visualize them I used dimensionality reduction with principle component analysis (PCA) and plotted the first three principle components in varying combinations to see if any matching clusters emerged. The plots were not so easy to interpret, but there is a concentration of rich and full-bodied wines at the center, with lighter wines radiating outward.
I took note of the number wines in each style and found that dessert, sparkling, and rose wines were not as well represented as the others. So I began removing one topic at a time, running the TruncatedSVD model, and seeing if I could better interpret the results. The topics for 7 and 5 were promising and I will most likely look into these groupings in future studies.
A Simple Recommendation System
Lastly, I decided to take what I learned about wines and build a simple, but fun recommendation system. I took common terms from the descriptions, divided them up into three groups according to the 12 main categories of descriptive terms for wines, and let users create their own descriptions to see what wines they should try. The video below demonstrates one description chosen by me!
CHEERS!