
Run...or Walk?
My model tells me you are neither walking nor running right now…
 as you sit reading this blog post.
The Project
Courtesy of Kaggle and Viktor Malyi, I acquired a set of accelerometer and gyroscope data that tracked a person’s activity over time. From the data, I wanted to create a model that could determine whether the user was running or walking. The data and description of its collection can be found here: www.kaggle.com/vmalyi/run-or-walk.
Initial Data Exploration
I wanted to check to make sure there was a fairly even spread of observations in my data. In other words, I wanted equal observations for running, walking, and wrist placement. Turns out, we were looking pretty good:
| Activity | Wrist | Observations |
|---|---|---|
| running | right | 20657 |
| running | left | 23708 |
| walking | right | 25601 |
| walking | left | 18622 |
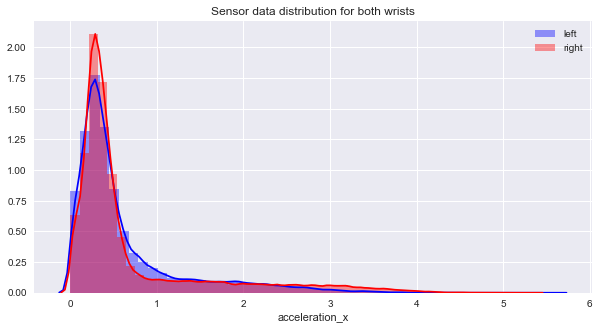
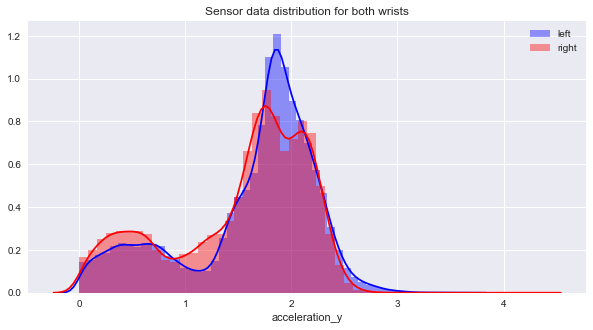
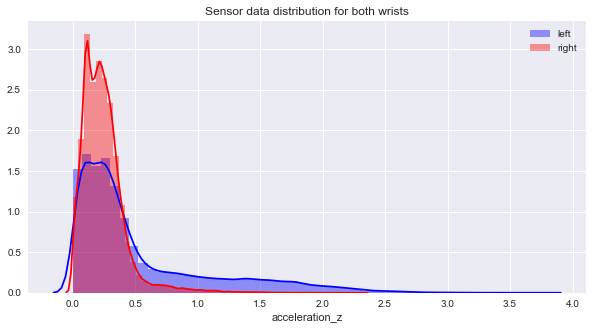
I also wanted to make sure that my sensor data looked reasonable and that there wasn’t a difference between left and right wrist observations. That way I didn’t have to worry about two subsets of data or any crazy data manipulation. There wasn’t a big difference between wrist recordings, which was great! The accelerometer data in the x- and z- directions, however, had a bit of right- skewedness, which I hoped wouldn’t have too much of an effect later.
| Tri-Axial Accelerometer Distributions Comparing Wrists |
|---|
 |
 |
 |
The Modeling Proccess
Next, I dove right into modeling. I started with my raw data, all six of the sensors as features, and ran a simple K-Nearest Neighbor model. It wasn’t bad! I decided, as part of the learning process, to run all of the classification models that we had covered so far:
- K-Nearest Neighbors: with scaled data and a grid search with cross- validation to pick the best k-value
- Logistic Regression
- Gaussian Naive Bayes
- Bernoulli Naive Bayes
- Random Forest Classifier: with scaled data and a grid search to find best number of trees
- Gradient Boosted Classifier: with scaled data and a grid search to choose best parameters*
- Support Vector Machine with Linear Kernal
- Support Vector Machine with Radial Basis Function
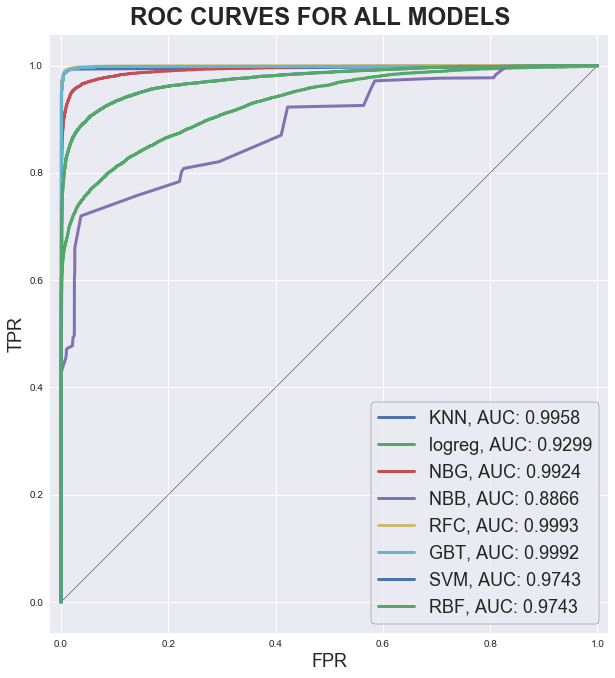
And the winner is…
** Random Forest Classifier ** The model with the best accuracy and AUC score was the gradient boosted classifer. It was very close to the random forest classifer as seen in the ROC curve below:
Up Next
Since I was able to come up with a near perfect model using the raw data, there wasn’t much use in modifying the features or trying to really clean up the data for the model. But out of my own interest in signal processing, I have gone through several measures to smooth out the accelerometer reading and to identify the frequency response difference between running and walking. I also started to play with cool visualization techniques in D3, Plotly, Bokeh, and Tableau, but more on those next time!