What to do when your model is almost too good?
…find a problem with it

I thought more about what I wanted to accomplish with the activity classifier and I realized that a Random Forest Classifier would be too computationally intensive to use on a wearable-sized device. Also, the models I was using are not necessarily meant for time series data. Technically the model worked, but it considered the data as a random collection of labeled x-, y-, and z-accelerations and angular velocities rather than a series of time-dependent measurements.
So, I decided to look at the data as a time series and consider other metrics that would be more practical for a live stream of accelerations and angular velocities.
Time and Cadence: Sounds like a frequency problem
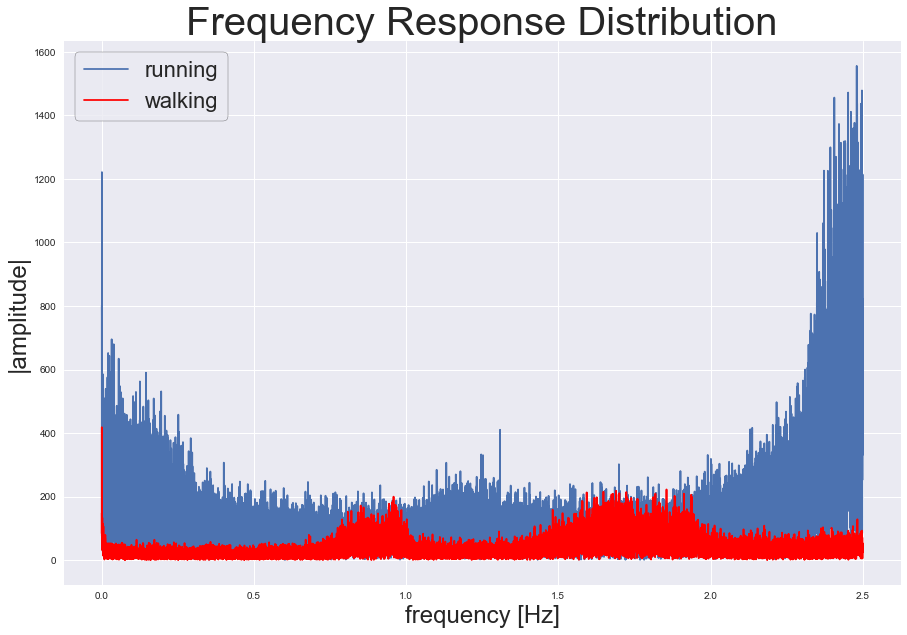
My first idea was to look into the frequency domain and take a fast fourier transform of the magnitude of acceleration to see what happened. It turns out that the fft does a pretty great job of distinguishing running from walking.
The average maximum frequency response of running occurs at a greater frequency and amplitude than the maximum of the walking acceleration magnitude.
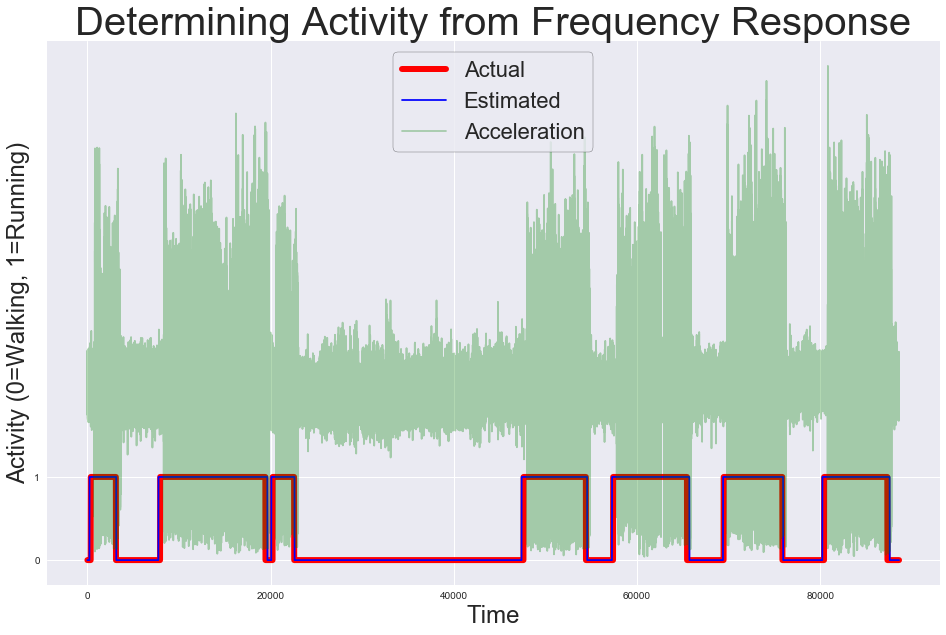
When I used the difference between the two mean maximum frequency responses as the threshold to distinguish walking from running across the entire dataset, the results exactly matched the original walking vs running labels:
Wearable Tech: Low Processing Power
Unfortunately, FFT is too computationally intensive to calculte live-time on the small electronics typically found in activity trackers. So I had to funnel down deeper and consider simpler metrics, such as the mean, maximum, minimum, standard deviation, median, and median absolute deviation. Any of these methods would be very easy to process in a wearable device in live-time. Luckily, many of these metrics also did a decent job distinguishing walking from running.
Generally speaking though…
None of the specific results and thresholds produced from the above metrics will be useful for any runner other than the one subject in this dataset. Unfortunately, no one else will have the exact same cadence, body build, arm swing, etc which means any model I’ve created won’t generalize to the population. If I were to continue this project, I would get data from a variety of subjects and see if I could develop a better, more generalizable model.
I also had some fun with data visualization
I tried my hand at Plotly, D3, and Flask
Plotly:
Two ways to compare the distributions of metrics for walking vs. running